
Enhanced Battery Test Insights with Electrochemical Impedance Spectroscopy
Battery cells constantly change in form factor, capacity, chemistry, and application. And new types enter the market daily. However, all this traction is not changing one thing: the need for battery cells to be tested to ensure safety, performance, quality, and reliability.
Once a battery has passed its early development stages with an open structure, it becomes a closed one, limiting the possibilities of examining the different layers and components in a non-disruptive way. This makes it harder to gain insight into the battery. But different tests can help to get a deeper understanding of the battery’s structure and behavior without destroying it.
In this overview, we will cover one powerful method, electrochemical impedance spectroscopy (EIS).
The Theory Behind EIS and How the Data Can Be Utilized
An EIS instrument works by applying a sinusoidal AC current to the cell and then measuring the AC voltage response of the cell. The ratio of voltage to current is resistance R, if measured at DC. However, when an AC current is applied, this measurement is impedance Z, consisting of the real part R and an imaginary part X. The AC current is swept (often over a wide range of frequencies, such as 0.1 Hz to 10 kHz), and the voltage response is measured at each frequency in the sweep.
Sometimes, a more efficient method is employed that just checks voltage at a few specific frequencies, which simplifies the EIS instrument, lowering its cost and speeding up the time it takes to perform the EIS measurement sweep. Another variation on EIS is to apply a current pulse and use mathematics, such as a fast Fourier transform (FFT), to extract the frequency content of the response of the cell.
However, regardless of which EIS stimulus scheme is used, the fundamental concept is the same: apply a range of frequencies of current to the cell and measure its voltage response at each frequency.
Once the stimulus is applied and the response captured, a chart known as a Nyquist plot is generated by plotting the real impedance on the horizontal axis and the inverse of the imaginary impedance on the vertical axis (see the upper portion of Figure 1). The software that controls the EIS will generate the Nyquist plot from the raw sweep data. The Nyquist plot is a common way to represent the electrochemical impedance.
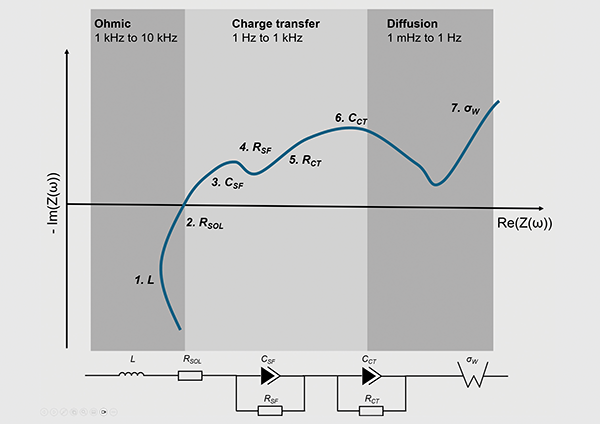
The physical processes are distributed at different frequencies:
- Inductance of wires and cell structure (at high frequencies);
- Double-layer charging at mid frequencies (100 Hz) is followed by the resistive charge-transfer process at lower frequencies (1-100 Hz); and
- At low frequencies (<1 Hz), the materials diffusion processes at the electrode are observed.
The EIS data and the Nyquist plot can be further manipulated using equivalent circuit modeling to extract an electrical equivalent circuit model (ECM) of the cell (see the lower portion of Figure 1. This ECM will show specific features in the cell, such as the cell’s internal resistance.
Nyquist vs. Bode Plot
Spectra, in general, can be plotted in different ways. The most common one is the Bode plot for frequency response analysis, such as the attenuation or gain.
A Bode plot is normally not only one plot but two separate plots, a magnitude plot and a phase plot. The magnitude plot uses a logarithmic scale on the x-axis for the frequency, and the y-axis contains the magnitude or attenuation. The phase plot uses a logarithmic scale as well for the frequency, but plots the phase over it.
Bode plots are very powerful for systems with filter characteristics. The way the plot is generated, changing behavior at frequencies can be detected and verified easily. This is why Bode plots are the most common for identifying the bandwidth of an amplifier or the cut-off frequency of a filter.
A Nyquist plot is generated differently, as there is no direct labeling or frequency scale in the plot. There is only one plot where the x-axis refers to the real part and the y-axis to the inverted imaginary part. Each point in the plot is one frequency, and, in regular cases, lower frequencies appear on the right side while higher frequencies appear on the left side.
Plotting the impedance measurements generated during an EIS measurement in a Nyquist plot provides several benefits: Visual detection of processes, easy model fitting, noise tolerance, and simplicity. The Nyquist plot also makes it easier to detect chemical processes in the battery. For example, a charge transfer is indicated by a semicircle, and a 45° line represents diffusion (both can be seen in Figure 1).
As these processes can be easily separated visually in the plot, they could also be used to fit equivalent components to it as part of an ECM. For example, the logarithmic scale of a Bode plot could amplify noise, especially in lower frequencies. This does not happen with a Nyquist plot, where the frequency is not labeled and only one plot is needed to present the measured value.
Impedance vs. Resistance
Resistance and impedance are related and depend on each other, but are not interchangeable. Resistance is the fundamental characteristic, identifying how much a material opposes the current flow at a voltage/potential. Ohm’s Law is the representation of this:
Resistance is a scalar quantity and measured in ohms (Ω). The limitations of the resistance are in its static nature. A battery is a complex, dynamic system with different dependencies.
The impedance Z could be seen as the extension of the resistance. It contains a resistive part R and, in addition, either a capacitive or inductive part X. As it is an advanced construct, a scalar representation is not possible. Mathematically, a vector or complex number is used. The resistive part is represented by the real portion, and the imaginary part represents the capacitive or inductive portion. The imaginary part contains a frequency dependence.
As described earlier in this article, electrochemical impedance spectroscopy measures at various frequencies in a sweep. The test performed with a sinusoidal stimulus provides back an impedance with real and imaginary parts at the given frequency. Resistance measurements are normally performed with a constant current stimulus or, for batteries, mainly as pulses. The voltage response is measured, and based on the known stimulus and the measurement, the resistance can be evaluated via Ohm’s law.
Resistance and impedance have their use case for battery characterization and to rate the performance, quality, and health, but serve different purposes. Resistance refers mainly to the internal resistance of a battery. This could be used as an indicator of health and age within a known battery family: same chemistry, capacity, type. But the resistance is not selective. It is one value for the given state of charge (SoC) and includes all subparts in the battery.
As described earlier, the impedance is more selective. Depending on the frequency and shape of the responses in the Nyquist plot, it could be used to identify which part of the battery is behaving in which way.
EIS in the Test Lab and Beyond
EIS is a classic test performed in a laboratory, but there are differences in the way the test can be performed and what equipment is used.
One way is to use a dedicated EIS instrument in a dedicated environment. This allows the most in-depth test and analysis, but it is usually limited to a single channel. As it is a direct connection between the test instrument and the device under test, the whole signal chain can be optimized to allow the test to operate at higher frequencies.
In this aspect lies the greatest challenge and source of noise for EIS. The higher the stimulus frequency goes, the greater are the influences of the signal chain, consisting of cables, contactors, and fixtures. The test procedure is reaching into areas where RF effects become more relevant. With a single channel and direct connection, cable shielding, stiffness, connector optimization, and selection can be considered and adjusted to the bandwidth that should be achieved. This allows a high upper frequency limit but limits flexibility.
Another option is to use a battery test system with high dynamics. This allows performing EIS measurements during an extended test, including an aging test, a capacity test, or a performance test. While the bandwidth could not compete with a standalone system, its benefits are in the usability. No rewiring is needed, all available channels can be used, and the data is available in the same environment as the rest of the battery test results.
This is possible in cases where the battery test system is able to generate sinusoidal signals and can read back the responses accurately. Limitations here are primarily caused by the bandwidth limits of the power electronics in the battery test systems, which are not optimized for signal generation, and the cable, or, more precisely, the signal chain. A frequency up to 10 kHz can be achieved. This already provides deeper insight into the battery’s performance, which can be achieved without rewiring and external equipment. This is boosting efficiency in a high-scale lab with higher numbers of test channels and DUTs tested in parallel.
Despite the usefulness of EIS in test laboratories, battery management systems (BMS) are more recently being developed that utilize the measurement type. The idea is to use EIS to better determine the state of health (SoH) of individual cells in a battery pack or to detect defects and issues faster and with higher precision. This is a new approach that could help in the future, not only to determine the health and status of a battery during its regular operation, but also for second-life applications. With direct EIS measurement capability, age and remaining longevity can be determined more easily. This could help to achieve a grading faster and more precisely, rating the batteries for further use with higher reliability and precision.
What to Remember
EIS can be used to learn a great deal about the processes inside the cell (like charge transfer and double-layer charging). It can be manipulated via ECM software to create an equivalent circuit that describes specific elements inside the cell. Using EIS can also help us understand the aging process more efficiently and more holistically. It allows detecting aging influences early on and provides a better prediction of the battery’s final performance.